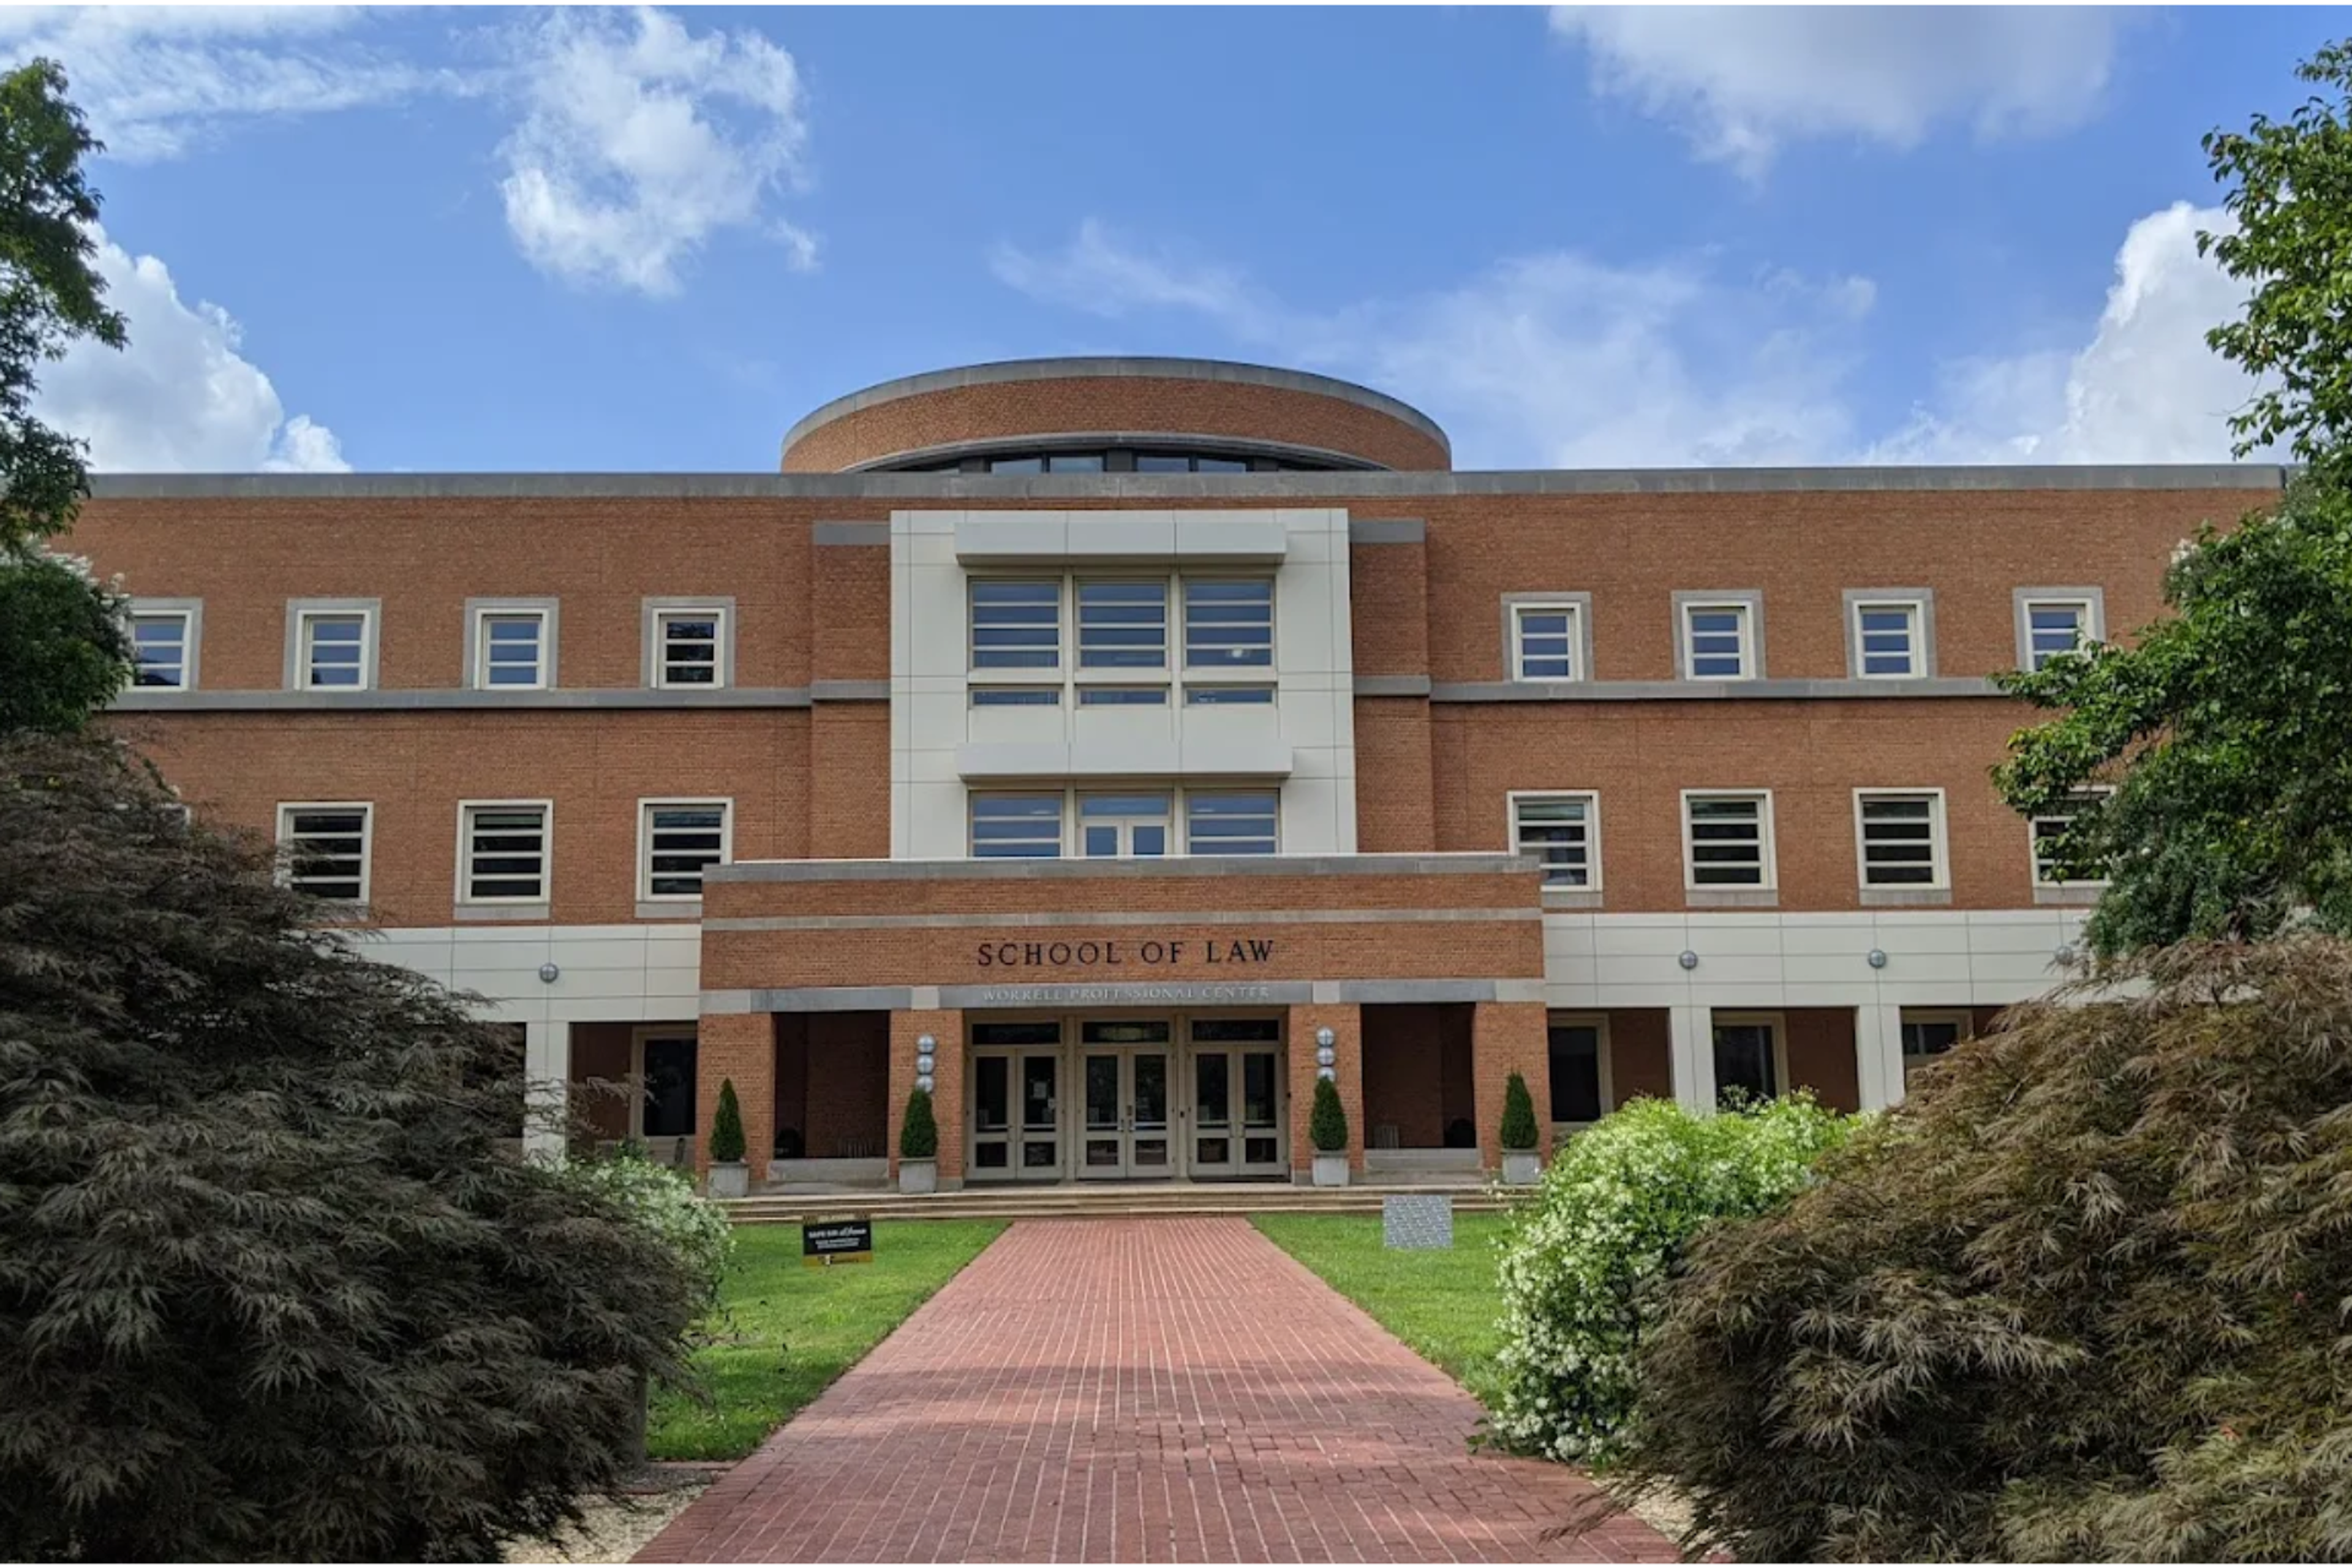
T14 Law Schools: Acceptance Rates & Class Profiles
An overview of the demographics, median test scores/GPAs, geography, and more of the top 14 law schools in the US, as well as their acceptance rates and class sizes.
Posted January 28, 2026

Join a free event
Learn from top coaches and industry experts in live, interactive sessions you can join for free.
Table of Contents
Law is a highly competitive and rigorous field of study, and acceptance into one of the top-ranked institutions can be incredibly challenging. This is why knowing the acceptance rates and class profiles of each of these prestigious T14 law schools matters.
In this article, we'll examine the acceptance rates and class profiles of the T14 law schools. We'll discuss what these schools look for in their applicants, how they compare to one another regarding selectivity and student body demographics, and what that means for those who hope to attend. Knowing where these top institutions fall in law school rankings can provide valuable insights for aspiring candidates.
What Are the T14 Law Schools?
At a glance, the schools usually considered part of the coveted “T14” in law school rankings include:
- Yale Law School
- Stanford Law School
- University of Chicago Law School
- Columbia Law School
- Harvard Law School
- University of Pennsylvania Carey Law School
- New York University School of Law
- University of Virginia School of Law
- University of California, Berkeley School of Law
- Duke University School of Law
- University of Michigan, Ann-Arbor Law School
- Northwestern Pritzker School of Law
- Cornell Law School
- Georgetown University Law School
Read: How to Get Into a T14 Law School and JD Application Deadlines of the T20 Law Schools
The T14 law schools consistently rank at the top of national law school rankings, drawing the most competitive applicants.
Top 14 Law School Acceptance Rates
| Law School | Acceptance Rate |
|---|---|
| Yale Law School | 5.62% |
| Stanford Law School | 6.88% |
| University of Chicago Law School | 14.24% |
| Columbia Law School | 11.8% |
| Harvard Law School | 10% |
| University of Pennsylvania Carey Law School | 9.74% |
| New York University Law School | 15.65% |
| University of Virginia Law School | 12.88% |
| University of California, Berkeley | 13.70% |
| Duke Law School | 10.74% |
| University of Michigan, Ann-Arbor | 13.51% |
| Northwestern Pritzker School of Law | 15.05% |
| Cornell Law School | 17.44% |
| Georgetown University Law School | 17% |
U.S. News & World Report rankings often list these institutions as leading in legal education, reflecting their rigorous academic and professional preparation.
1. Yale Law School
Known for its strong commitment to diversity and inclusion, Yale Law School has one of the highest representations of BIPOC students among other law schools. Its diverse student body shapes a dynamic learning environment. Yale consistently ranks as the #1 law school in law school rankings online and leads in News World Report rankings for legal education, highlighting its academic rigor and student support. Its small class sizes, rigorous academic programs, and high placement in influential legal roles make it highly selective and prestigious.
Yale Law School Acceptance Rate: 5.62%
Class Profile (2027)
- Women: 56%
- BIPOC: 50%
- First Generation:20%
- Average Age: 24
- 1-2 Years Out of College: 89%
- Foreign Countries Represented: 12
- Median GPA: 3.96
- Median LSAT: 174
2. Stanford Law School
Situated in Silicon Valley, Stanford Law School emphasizes interdisciplinary and experiential learning, allowing students to integrate legal studies with fields like technology and public policy. Stanford Law School also offers unique programs that other law school programs do not like the "Global Quarter," which immerses students in international law and finance in cities worldwide. Stanford also offers impressive criminal law, constitutional law, and business law programs likewise. This diversity fosters a close-knit, innovative community, ideal for students seeking to blend law with emerging industries.
Stanford Law School Acceptance Rate: 6.88%
Class Profile (2027)
- Women: 50%
- BIPOC: 61%
- First Generation: 20%
- Foreign Countries Represented: 76
- Median GPA: 3.96
- Median LSAT: 173
- Median GRE: 164 (V); 164 (Q)
3. University of Chicago Law School
The University of Chicago Law School stands out for its rigorous intellectual environment and emphasis on the Socratic Method, promoting critical thinking and analysis. Known for producing leaders in academia and judiciary, Chicago Law School boasts a vibrant academic community focused on legal scholarship, with students frequently engaging in law journals and research. Criminal law, business law, and constitutional law are some of the most popular courses as this law school.
University of Chicago Law School Acceptance Rate: 14.24%
Class Profile (2027)
- Women: 49%
- BIPOC: 40%
- Median GPA: 3.94
- Median LSAT: 173
- States Represented: 32 (including Washington, DC)
- Undergraduate Institutions Represented: 87
- Graduate Degrees: 21 students
- Languages Spoken: 98 students speak a language other than English, with over 30 languages represented
- Research Assistants: More than 85 students
- Published Authors: More than 40 students

4. Columbia Law School
Located in New York City, Columbia Law School offers unmatched access to the legal and financial heart of the U.S. Columbia University students benefit from the school’s extensive alumni network and unique programs like the Human Rights Institute, which equips students to tackle global challenges. The school’s emphasis on public interest law and international opportunities makes it attractive to globally-minded students.
Columbia Law School Acceptance Rate: 12.20%
Class Profile (2027)
- Women: 52%
- BIPOC: 52%
- LGBTQ+: 26%
- International: 19%
- Undergraduate Institutions Represented: 143
- Foreign Countries Represented: 21
- Median GPA: 3.90
- Median LSAT: 173
5. Harvard Law School
As one of the largest and oldest law schools, Harvard Law School provides vast resources, a strong alumni network, and diverse academic offerings. It is often ranked alongside Yale Law School as one of the best law schools in the nation, particularly known for its criminal law and constitutional law programs along with the competitive candidate process.
Known for its extensive clinic programs like the Criminal Justice Institute, Harvard Law School combines practical legal training and legal writing with academic rigor and student programs, preparing students for leadership in various sectors as graduates. Harvard Law’s constitutional law program is also highly regarded, attracting students interested in impactful legal careers.
Harvard Law School Acceptance Rate: 11%
Class Profile (2027)
- Women: 53%
- BIPOC: 43%
- LGBTQ+: 22%
- First Generation/Low-Income: 11%
- ≥1 Year Out of College: 79%
- International: 9%
- Foreign Countries Represented: 20
- Median GPA: 3.95
- Median LSAT: 174
- Median GRE: 167 (V); 165 (Q)

Harvard Law School — Resume Template & Example
Download this free HLS resume template and example to help you prepare the strongest application possible
6. University of Pennsylvania Carey Law School
Penn Carey Law integrates cross-disciplinary learning through its close ties with Wharton and other Penn graduate law schools. With a high percentage of students pursuing joint degrees, Penn emphasizes practical, real-world applications of law, especially in business and entrepreneurship, setting it apart for those interested in combining law with other fields.
University of Pennsylvania Carey Law School Acceptance Rate: 9.9%
Class Profile (2027)
- Women: 50%
- Students of Color: 49%
- LGBTQ+ Students: 28%
- First-Generation College Students: 12%
- First-Generation Professional School Students: 33%
- Average Age: 24
- Advanced Degrees: 7%
- Out of College One or More Years: 73%
- Countries Represented: 3
- Median GPA: 3.93
- Median LSAT: 172
7. New York University School of Law
New York University School of Law is distinguished by its focus on public interest and global law. With renowned programs in areas like tax law, human rights, and environmental law, NYU law school equips students with diverse legal perspectives. Located in Greenwich Village, it provides rich cultural and professional networking opportunities in New York City.
New York University School of Law Acceptance Rate: 16.76%
Class Profile (2027)
- Women: 57%
- BIPOC: 41.6%
- 1-2 Years Out of College: 70%
- Median GPA: 3.90
- Median LSAT: 172
Coach Recommendations

8. University of Virginia Law School
Known for its collegial culture and beautiful campus, the University of Virginia Law School (UVA Law) emphasizes leadership, ethics, and public service. Its strong ties to Washington, D.C., offer students networking opportunities in government and policy-making, with many students engaging in clinics and externships that make a real-world impact.
New York University School of Law Acceptance Rate: 5.9%
Class Profile (2025)
- Women: 54%
- BIPOC: 29%
- Average Age: 24
- Foreign Countries Represented: 3
- Median GPA: 3.96
- Median LSAT: 172

9. University of California, Berkeley Law School
Berkeley Law School is recognized for its progressive stance and expertise in intellectual property, technology, and environmental law. This stance makes it one of the top law schools in the nation for environmental and agricultural law. Located near Silicon Valley, it offers students exposure to tech and startup law, appealing to those interested in cutting-edge legal challenges in innovation-driven fields.
University of California, Berkeley Law School Acceptance Rate: 14.9%
Class Profile (2027)
- Women: 62%
- BIPOC: 57%
- LGBTQ+: 25%
- First Generation: 14%
- Foreign Countries Represented: 8
- Median GPA: 3.87
- Median LSAT: 170
10. Duke Law School
Duke University School of Law is known for its interdisciplinary approach, allowing students to pursue joint degrees in areas like environmental management and public policy. The law school emphasizes public service and offers international study opportunities, making it ideal for students with diverse academic interests.
Duke Law School Acceptance Rate: 4.6%
Class Profile (2027)
- Women: 54.4%
- BIPOC: 40%
- LGBTQ+: 23%
- First Generation: 16%
- International: 10%
- Average Age: 24
- Median GPA: 3.89
- Median LSAT: 170
Looking to get into a T14 Law School?
Work with an expert coach who knows what it takes to get into the most prestigious of schools
- Indrani S.: Associate Director of Admissions at Stanford Law School, 150+ Successful Clients
- Machmud M.: Knight Hennessy Scholar (JD and MBA at Stanford), Rhodes Scholar
- Kevin P.: Uchicago Admissions Officer, JD from Duke, 100+ Successful Clients
11. University of Michigan–Ann Arbor Law School
University of Michigan–Ann Arbor is the top Michigan Law School, with an emphasis on inclusivity and rigorous legal education makes it a highly competitive program in law school rankings.
With a focus on academic rigor and inclusivity, Michigan Law School fosters a collaborative environment. Known for its international law programs, the school’s global focus is supported by partnerships and exchange programs, drawing students interested in cross-border legal issues.
University of Michigan–Ann Arbor Law School Acceptance Rate: 4.6%
Class Profile (2027)
- Women: 48.4%
- BIPOC: 40.8%
- LGBTQ+: 24.6%
- First Generation: 13.4%
- International: 5.6%
- Median Age: 25
- ≥1 Year Out of College: 79%
- Countries Represented: 18
- Median GPA: 3.86
- Median LSAT: 171
12. Northwestern Pritzker School of Law
Northwestern Pritzker School of Law emphasizes practical legal skills, with strong connections to Chicago’s corporate and legal markets. The school’s accelerated J.D. program, hands-on clinics, and focus on business law make it a great choice for students aiming to quickly enter the legal workforce with substantial experience.
Northwestern Pritzker School of Law Acceptance Rate: 15.53%
Class Profile (2027)
- Women: 53%
- BIPOC: 54%
- International: 13%
- Average Age: 25
- Median GPA: 3.95
- Median LSAT: 172

13. Cornell Law School
Cornell Law School combines an Ivy League education with a supportive community. Its small class size promotes individualized attention, while strong programs in international and comparative law allow students to gain global legal perspectives through study abroad programs. This is what makes Cornell Law School a highly coveted choice for law students across the nation.
Cornell Law School Acceptance Rate: 5.8%
Class Profile (2027)
- Women: 44%
- Minority Representation: 40%
- International: 8%
- Median Age: 23
- Straight from College: 33%
- Countries Represented: 8
- Median GPA: 3.89
- Median LSAT: 173
14. Georgetown Law School
Located in Washington, D.C., Georgetown Law School offers unparalleled access to government agencies, NGOs, and global organizations. Its strong emphasis on public interest and international law, coupled with a large, diverse student body, makes it a top choice for students pursuing law in the public sector.
Georgetown Law School Acceptance Rate: 19.57%
Class Profile (2027)
- Women: 50%
- BIPOC: 40%
- First Generation: 12%
- Countries Represented: 28
- Median GPA: 3.91
- Median LSAT: 171
These numbers give a rough estimate of the class profiles and application cutoffs of the top-ranked law school options. However, the application process changes yearly depending on the number and background of applicants and the school’s priorities.
While they can provide an idea of what it takes to be admitted, there is no formula for success for law school admittance. Compile the best application that’s true to your story, and shoot for the stars!
Final thoughts
Getting into a T14 law school is no small feat, but understanding the numbers is a powerful first step. These class profiles and acceptance rates aren’t just statistics; they’re a snapshot of the academic strength, diversity, and ambition these schools are looking for. But remember: no applicant is perfect, and no single metric defines your potential.
If you're serious about aiming for one of these elite programs, don’t go it alone. Leland’s law school admissions coaches have helped applicants from all backgrounds craft standout personal statements, refine their resumes, and navigate the application process with confidence.
Work 1:1 with a top law school admissions coach to give yourself the best shot at breaking into the T14.
Here are other resources you may find helpful:
- JD Application Deadlines of the T20 Law Schools
- How Many Law Schools Should You Apply To?
- LSAT vs. GRE for Law School–Which to Take and How to Ace Both
- How to Get Into a T14 Law School
- Everything You Need to Know About LSAC and the CAS Report for Law School
- How to Write a Compelling Law School Personal Statement
FAQs
What is a T14 law school?
- A T14 law school refers to one of the top 14 law schools in the United States according to nationally-recognized law school rankings. These schools are known for their prestigious programs, high bar passage rates, and strong employment outcomes for graduates.
What LSAT score do you need for T14?
- To be competitive for a T14 law school, you typically need an LSAT score in the range of 165 to 175, though the exact score varies by school. A higher LSAT score significantly improves your chances of admission.
Is a 3.7 GPA good for T14 law schools?
- A 3.7 GPA is not a bad GPA for T14 law schools, but the strongest applicants often have GPAs closer to 3.8-3.9 or higher. Your LSAT score and personal statement can also help strengthen your application.
Is Berkeley law a T14?
- Yes, Berkeley Law is considered a T14 law school. It consistently ranks within the top 14 U.S. law schools, offering a highly regarded program with a focus on public interest and social justice.
What is the difference between T6 and T14 law schools?
- T6 law schools refer to the top six law schools, which generally have even higher admissions standards and prestige than the rest of the T14. T6 schools often offer the most robust career opportunities and are typically ranked in the top tier of the T14 list.
Browse hundreds of expert coaches
Leland coaches have helped thousands of people achieve their goals. A dedicated mentor can make all the difference.


