GMAT Score Chart by Percentile: What Your Score Really Means
Use the GMAT score chart percentile to see what your score signals for top MBA programs. Compare benchmarks and get clear next steps.

By Mihir G.
Custom GMAT Strategy | 765 Score (100th Percentile) | Chicago Booth MBA
Posted March 20, 2026


Table of Contents
Your GMAT score is more than just a number on a score report. What matters most is where you stand compared to other test takers. That position is shown through your GMAT percentiles.
MBA admissions teams don’t look at your raw score in isolation. They look at your percentile ranking to understand how you performed against the global pool of GMAT test takers. A 655 may sound strong, but its impact depends on whether it places you in the 70th percentile or the 90th. Schools also compare your results to their own class averages to see how you fit within their applicant pool.
In this article, you will learn how GMAT percentiles work, how to read the GMAT score chart correctly, and how to use percentile data to assess your competitiveness. By the end, you will understand exactly what your score signals to MBA programs and how to position your application strategically.
Read: 3 Things You Need to Know About the New GMAT Focus Edition
How GMAT Percentiles Work
What Is a GMAT Percentile? How It’s Calculated and What It Actually Tells You
A GMAT percentile shows how your score compares to other test takers. It represents the percentage of people you performed better than, not the percentage of questions you answered correctly. For example, scoring in the 80th percentile means you outperformed 80 percent of recent GMAT test takers. Because the GMAT is adaptive, your scaled score reflects both accuracy and question difficulty, not a simple tally of correct answers.
Percentiles are calculated by the Graduate Management Admission Council using data from recent testing periods. As the performance of the testing pool changes, percentile rankings can shift even if the scoring scale remains the same. Business schools rely on percentiles because they provide a consistent way to compare applicants across different test dates and versions. In a competitive MBA admissions process, your percentile communicates your relative standing within the global applicant pool.
Percentile vs. Score: Why 1-3 Points Can Matter
Under the GMAT Focus Edition, the total score scale ranges from 205 to 805. This differs from the legacy GMAT, which used a 200-800 scale and included the Analytical Writing Assessment and Integrated Reasoning as separate scored components. While the scale looks similar, the structure and scoring model are different, which is why understanding percentiles is critical under the current format.
In certain higher score bands, even a 1-3 point increase can meaningfully affect percentile ranking. For example, moving from 655 to 665 may shift you several percentile points because fewer test takers cluster at the top of the distribution. As scores rise, the distribution thins out. That means small score improvements can move you ahead of a larger portion of the testing pool than you might expect.
Two applicants with the same total score may appear identical on paper. However, admissions committees primarily evaluate overall score strength and section breakdowns, using percentiles as context for how a score compares within the broader testing population. A slight score increase that improves your percentile ranking can strengthen how your performance is interpreted relative to both the applicant pool and a school’s reported class averages.
Percentile Updates After GMAC Changes
The GMAT Focus Edition changed the structure of the GMAT exam. It now has three sections:
The older Graduate Management Admission Test included Integrated Reasoning and Analytical Writing Assessment, but those sections were removed in the new version. The total score scale also changed. When the new format was introduced, percentile rankings were updated to match the new scoring system. As more people took the Focus Edition, GMAC adjusted the percentiles again based on real test results. Because percentiles compare your score to other test takers, changes in the exam format can lead to changes in percentile rankings. That is why percentiles may look different from the previous version of the GMAT.
Why Percentiles Are More Insightful Than Raw Scores
A GMAT exam score only becomes meaningful when it is compared to other test takers which is why GMAT score percentiles and GMAT percentile rankings are so important. Percentile rankings show how your performance on the GMAT Focus Edition compares to the broader testing population, rather than just reporting a scaled score from the GMAT exam.
When business schools publish class profiles, they typically report average or median scores and score ranges, all of which are rooted in comparative performance. Understanding this helps you see how competitive your results are relative to both the applicant pool and a school’s class averages. In short, while your GMAT exam score reflects how many questions you answered correctly and how the test was scaled, percentile rankings reveal how you stack up, and that comparative insight is often what matters most in admissions decisions.
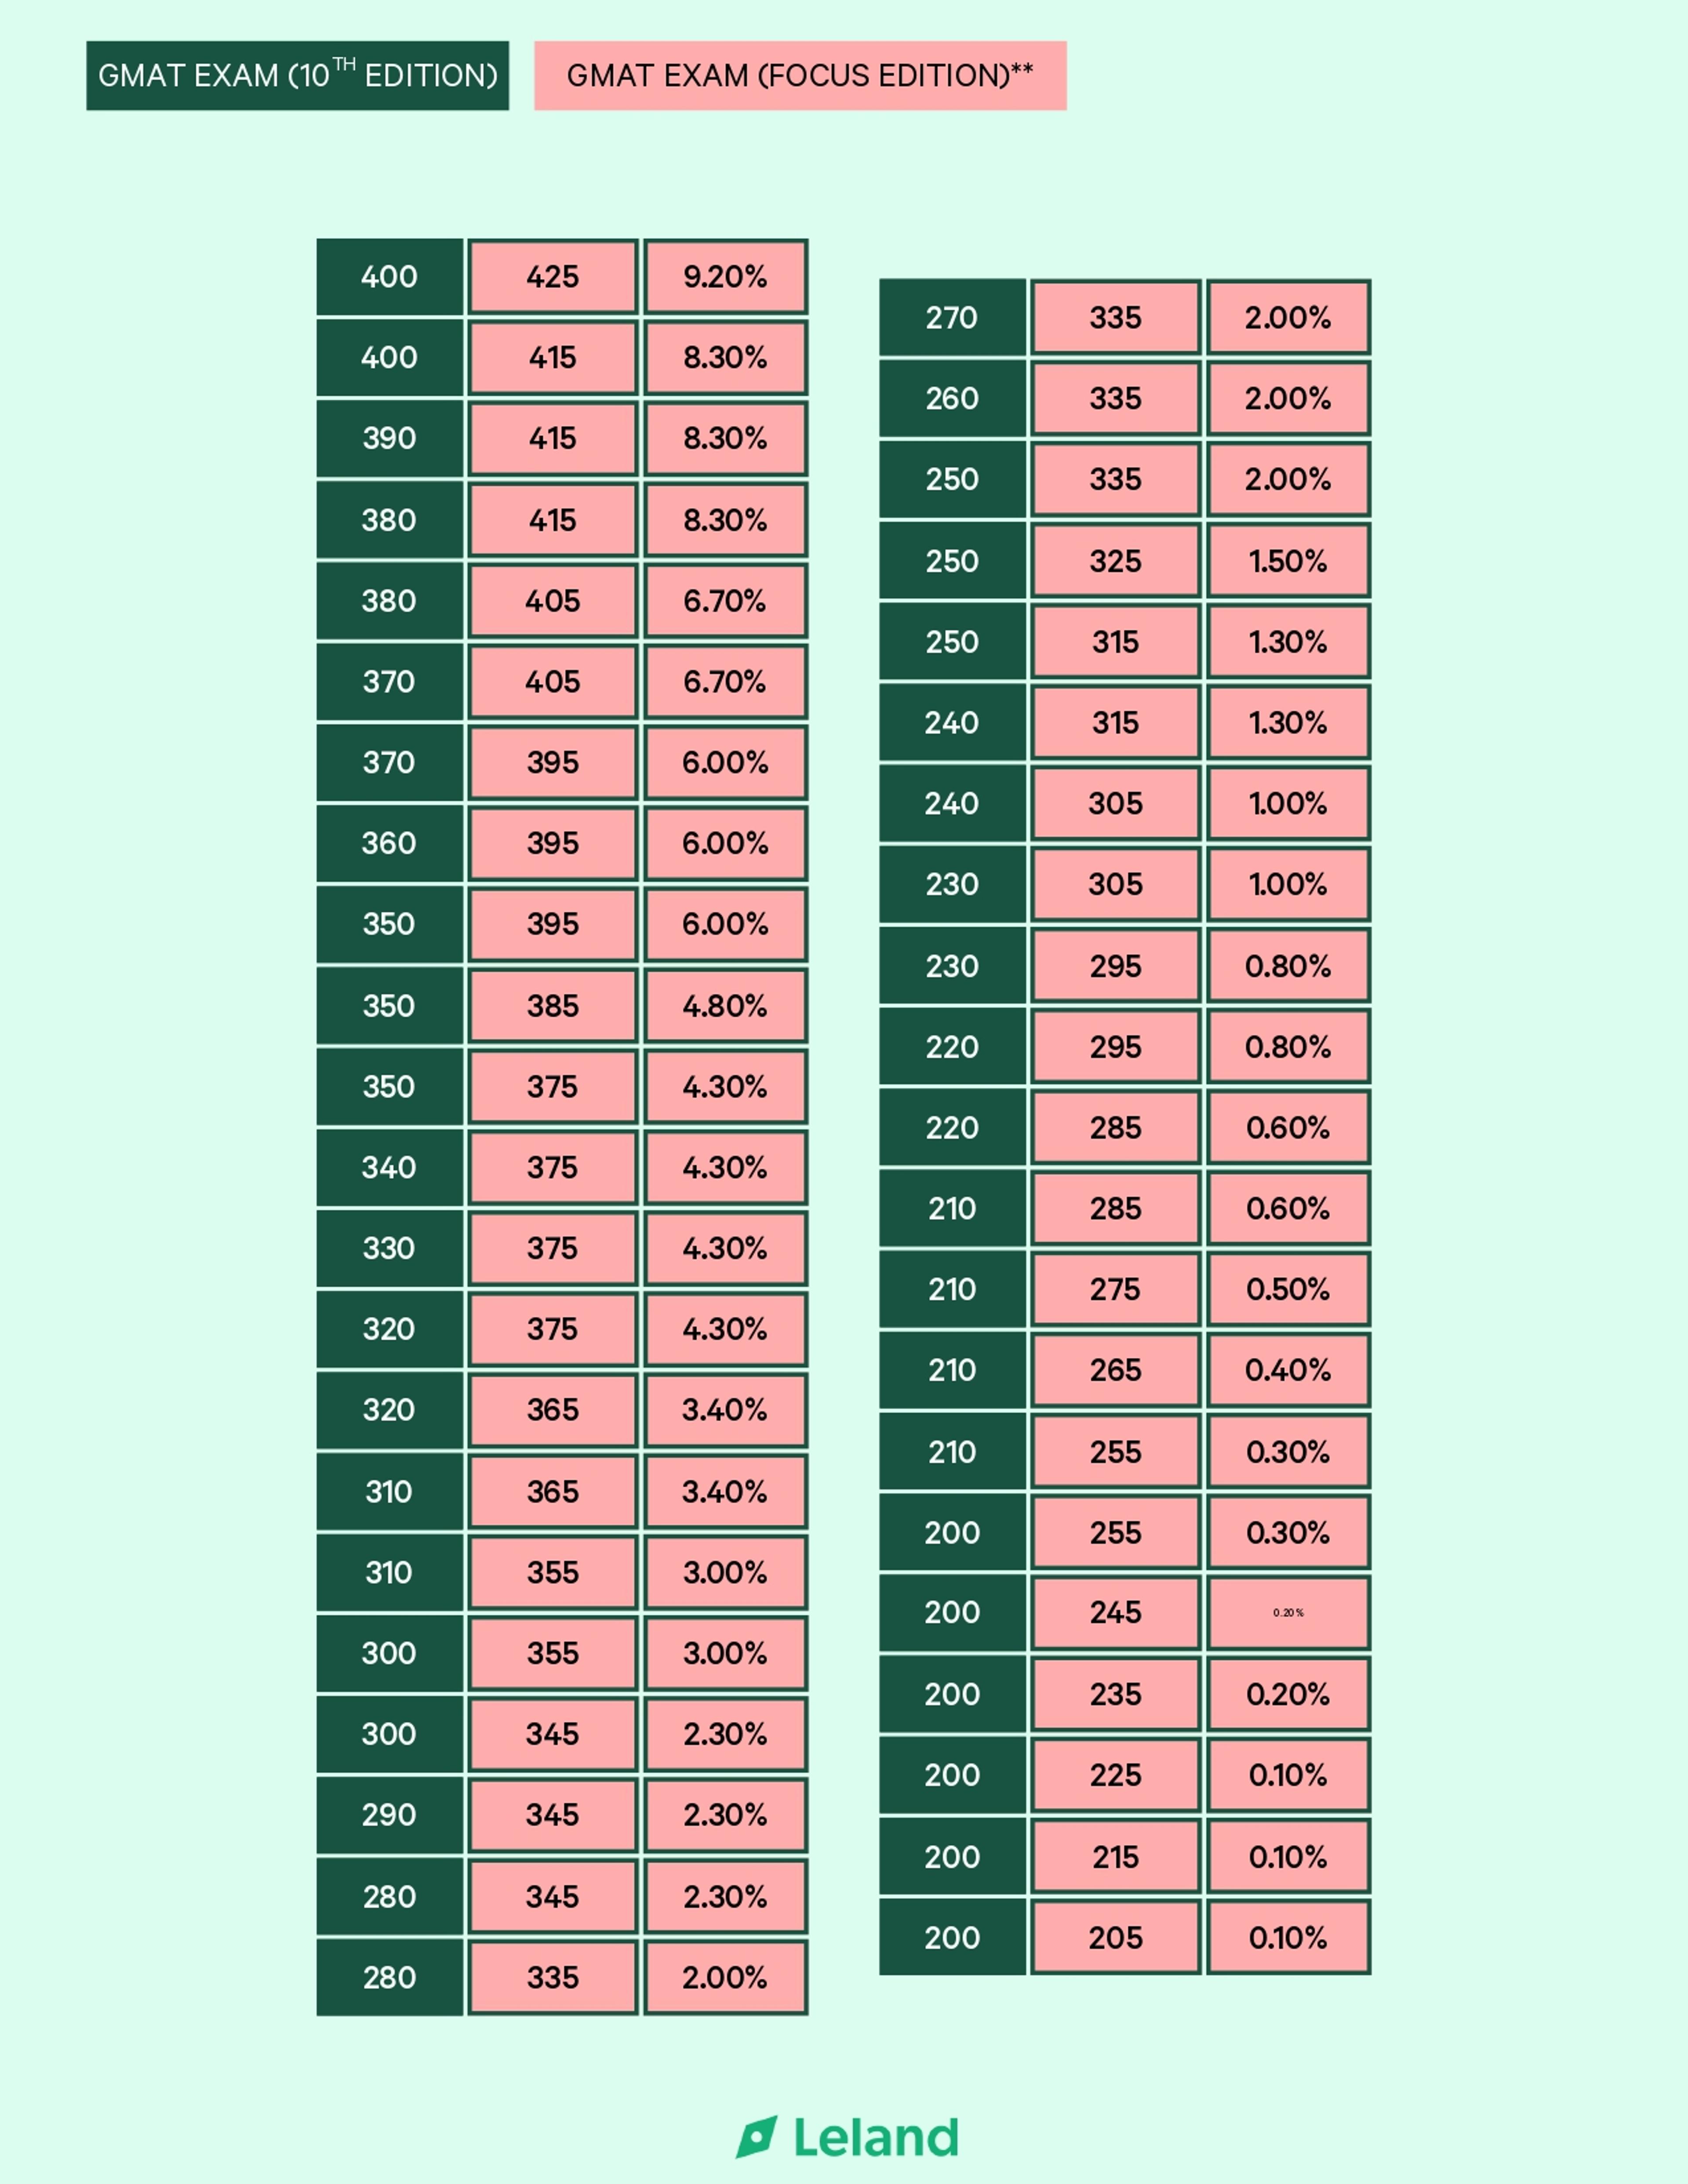
GMAT Score Chart (Total and Sectional Percentiles)
Master Table: GMAT Total Score vs. Percentile
The following table is a detailed example based on recent GMAC data for the GMAT Exam Focus Edition and the 10th Edition.
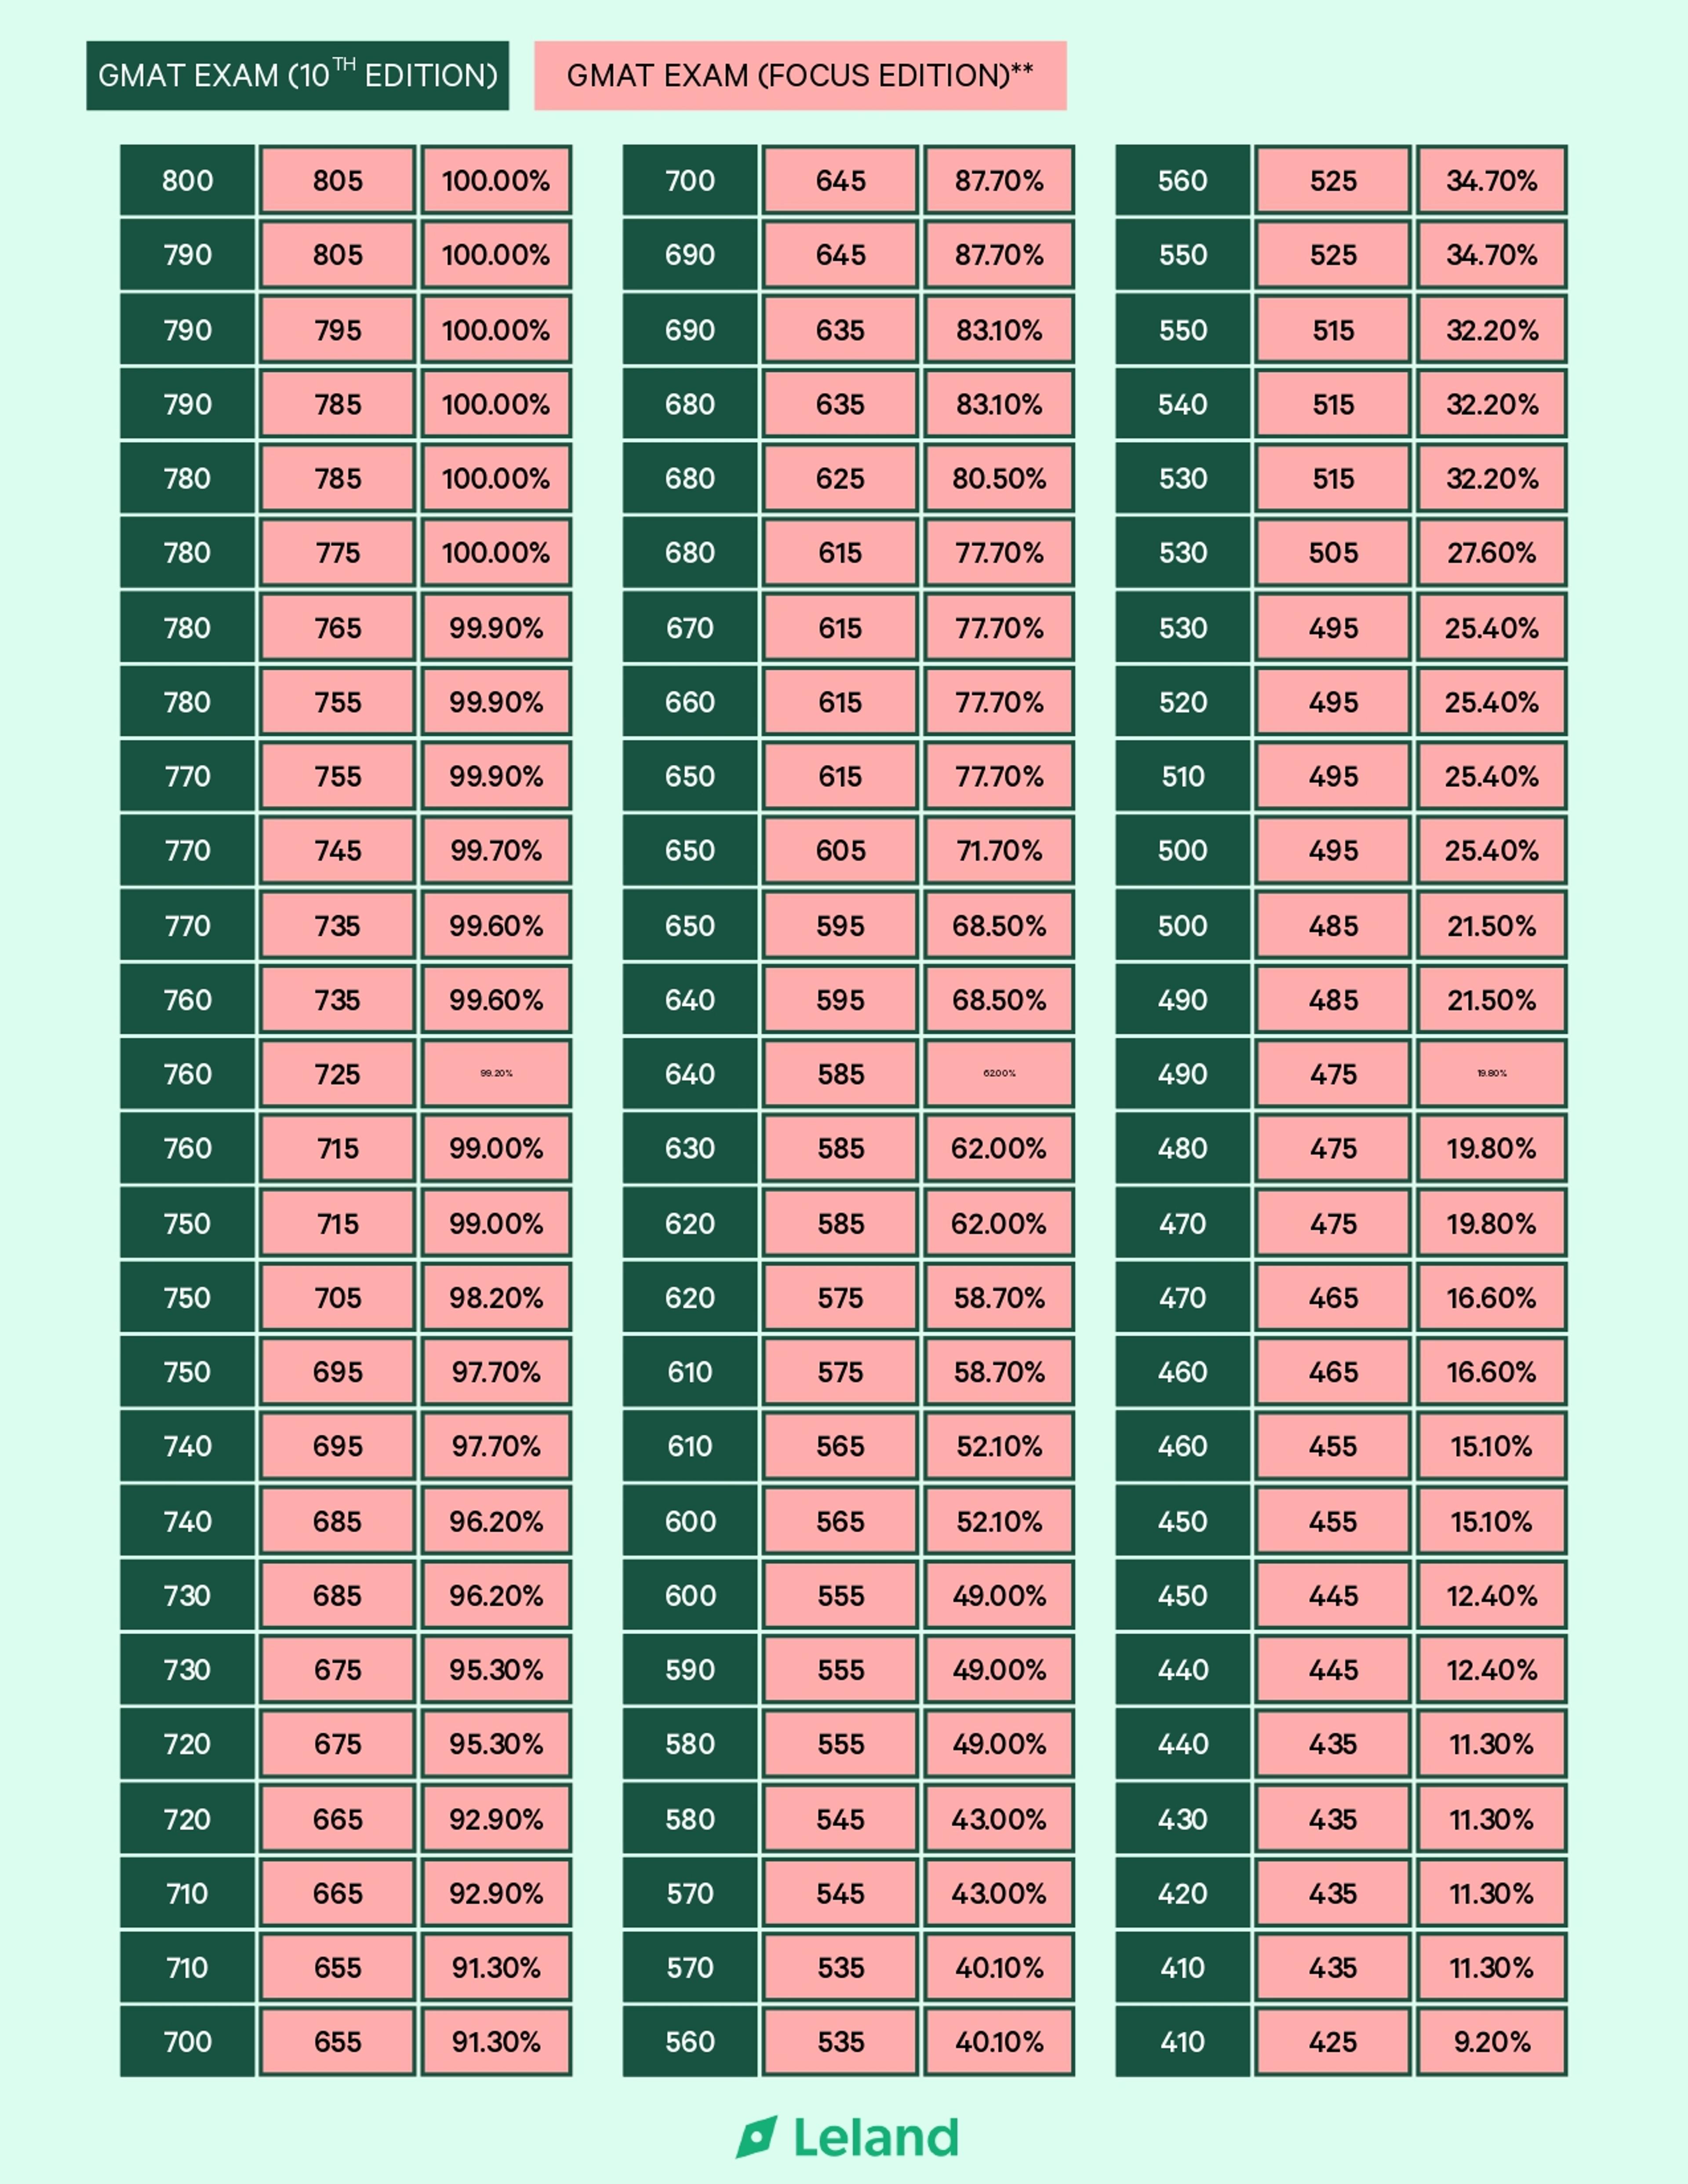
Think of this table as your insider’s map to the GMAT landscape. Also, take note that percentiles aren’t static. They shift each year subtly as the candidate pool changes, so always reference the latest GMAC data for the most accurate picture. And while a strong score can open doors, admissions teams weigh your full profile.
Use this as your strategic compass to plan your next move with confidence.
Read: What Is a Good GMAT Score? Score Range, Percentiles, and Target Benchmarks
Section Score Percentile Charts
Your section scores also matter. Business schools often review strengths in specific content domains.
Quantitative Reasoning (Quant Section)
| Score | Percentile Ranking |
|---|---|
| 90 | 100% |
| 89 | 97% |
| 88 | 96% |
| 87 | 94% |
| 86 | 91% |
| 85 | 88% |
| 84 | 85% |
| 83 | 80% |
| 82 | 75% |
| 81 | 70% |
| 80 | 64% |
| 79 | 57% |
| 78 | 50% |
| 77 | 43% |
| 76 | 37% |
| 75 | 32% |
| 74 | 26% |
| 73 | 22% |
| 72 | 19% |
| 71 | 15% |
| 70 | 13% |
| 69 | 10% |
| 68 | 8% |
| 67 | 6% |
| 66 | 5% |
| 65 | 4% |
| 64 | 3% |
| 63 | 2% |
| 62 | 2% |
| 61 | 1% |
| 60 | 1% |
The Quantitative section has a mean score of 78.06, with a sample size of 531,408, and a standard deviation of 6.35.
Verbal Reasoning
| Score | Percentile Ranking |
|---|---|
| 90 | 100% |
| 89 | 99% |
| 88 | 99% |
| 87 | 98% |
| 86 | 96% |
| 85 | 94% |
| 84 | 89% |
| 83 | 83% |
| 82 | 74% |
| 81 | 66% |
| 80 | 56% |
| 79 | 47% |
| 78 | 38% |
| 77 | 30% |
| 76 | 23% |
| 75 | 18% |
| 74 | 14% |
| 73 | 10% |
| 72 | 8% |
| 71 | 6% |
| 70 | 4% |
| 69 | 3% |
| 68 | 3% |
| 67 | 2% |
| 66 | 2% |
| 65 | 1% |
| 64 | 1% |
| 63 | 1% |
| 62 | 1% |
| 61 | 1% |
| 60 | 1% |
The Verbal Reasoning Section has a mean score of 79.34. The sample size is 531,348 with a standard deviation of 4.75.
Data Insights
The Data Insights section replaces parts of the old Integrated Reasoning.
| Score | Percentitle Ranking |
|---|---|
| 90 | 100% |
| 89 | 100% |
| 88 | 99% |
| 87 | 99% |
| 86 | 99% |
| 85 | 98% |
| 84 | 97% |
| 83 | 95% |
| 82 | 93% |
| 81 | 89% |
| 80 | 83% |
| 79 | 76% |
| 78 | 69% |
| 77 | 62% |
| 76 | 53% |
| 75 | 47% |
| 74 | 41% |
| 73 | 35% |
| 72 | 29% |
| 71 | 25% |
| 70 | 21% |
| 69 | 17% |
| 68 | 14% |
| 67 | 12% |
| 66 | 8% |
| 65 | 8% |
| 64 | 7% |
| 63 | 6% |
| 62 | 5% |
| 61 | 4% |
| 60 | 4% |
The Data Insights has a mean score of 75.03 and is based on 531,303 observations, with a standard deviation of 6.03.
See: 10 Best GMAT Tutors


GMAT Visual Score Bands (Competitiveness Breakdown)
| Competitiveness Level | GMAT Focus Score | Approx. Percentile | Legacy GMAT Equivalent |
|---|---|---|---|
| Median Range | 555 | ~48th | ~580-600 |
| Competitive Range | 575+ | 57th+ | 620+ |
| Strong Competitive | 595+ | 67th+ | 640+ |
| Upper Competitive | 615+ | 76th+ | 650+ |
| Top Quartile | 645+ | 86th+ | 690+ |
| Top Decile | 655+ | 90th+ | 700+ |
| Top Five Percent | 675+ | 95th+ | 720+ |
| Top Percentile | 705+ | 98th+ | 750+ |
What These Competitiveness Tiers Actually Mean
Score labels like “Good” or “Excellent” are shorthand. What truly matters is how your percentile positions you relative to other applicants and how that aligns with your target programs.
Median Range (555)
A 555 on the GMAT Focus Edition corresponds to approximately the 47.8th percentile based on recent data from the Graduate Management Admission Council. This means you performed better than about 48% of test-takers and slightly below the overall global median. This reflects typical performance within the broader testing pool but is below the average score reported by highly selective MBA programs.
Competitive Range (565+)
Scoring in this range places you slightly above the global midpoint. You are outperforming a majority of test-takers, but at highly selective programs, this score typically needs additional strengths (GPA, work experience, leadership impact) to balance it out. For regional programs or less selective MBA options, it can still be viable.
Strong Competitive (595+)
Crossing into the mid-600 equivalent range (legacy scale) shifts you meaningfully upward in the pool. You are now outperforming roughly two-thirds of test takers. Many nationally ranked MBA programs, particularly those outside the top 30-40, consider this a credible academic signal.
Upper Competitive (615+)
At this level, the GMAT is no longer a liability for most programs ranked in the 30-50 range. For top 25 schools, this becomes competitive but may sit near the lower end of their middle 80% range.
Top Quartile (645+)
This range is competitive for many top 25 programs and signals strong academic readiness. You are now outperforming roughly 85% of global test takers. For applicants targeting nationally elite schools, this is a strong academic foundation.
Top Decile (655+)
At 655+, you are entering territory commonly associated with the top 20 programs. Your score signals top-decile performance worldwide. Schools such as Cornell Johnson, UCLA Anderson, and Emory Goizueta typically view this range as comfortably competitive, assuming the rest of your application aligns.
Top Five Percent (675+)
A score of 675+ places you in roughly the top 5% of global test-takers, demonstrating outstanding GMAT performance. This range strongly positions you for many top-tier MBA programs, though it may sit slightly below the median at elite schools like Wharton, Kellogg, and Chicago Booth. While no score guarantees admission, achieving 675+ effectively removes standardized testing as a barrier and signals strong academic readiness.
Top Percentile (700+)
A score of 700+ places you in roughly the top 1-2% of global test-takers, signaling exceptional performance on the GMAT. This range aligns with the median or above at elite top 10 programs like Wharton, Stanford, HBS, MIT Sloan, Kellogg, and Chicago Booth. Achieving 700+ positions you as academically very competitive, effectively removing standardized testing as a limiting factor and demonstrating readiness to thrive in the most selective MBA classrooms.
Note: If you haven’t taken the GMAT yet but would like to estimate your percentile ranking, try this online GMAT percentile ranking calculator. But remember, this can provide estimates of total scores, but they cannot guarantee accuracy due to variations in test-taker performance.
What These Percentiles Mean for Top MBA Programs
Top 10 MBA Program Benchmarks
The US News World Report has released the average GMAT scores for top-tier business schools. These scores not only reflect the academic caliber of admitted students but also offer insight into the competitive landscape of elite MBA programs.
| School | Average GMAT Score |
|---|---|
| Stanford University (CA) | 738 |
| Columbia University (NY) | 734 |
| New York University (Stem) | 733 |
| Harvard University (MA) | 732 |
| University of Pennsylvania (Wharton) | 732 |
| University of Chicago (Booth) (IL) | 729 |
| University of Michigan (Ross) | 728 |
| Darmouth College (Tuck) (NH) | 727 |
| Massachusetts Institute of Technology (Sloan) | 727 |
| Yale University | 725 |
Key insight: Top MBA programs don’t settle for “average.” They’re admitting candidates in roughly the top 1-2% globally of all the test takers. These figures reflect class composition rather than hard cutoffs. Elite programs admit candidates across a distribution range particularly when other dimensions of the profile are exceptional.

MBA Application Checklist
Download a free, customizable MBA application checklist to stay organized at every part of the process.
Percentile Targets for Scholarships
While each school uses its own internal model, patterns across programs suggest:
- 90th percentile+ materially strengthens merit aid positioning
- 95th percentile+ can place you in serious scholarship consideration territory at many programs
- Strong individual section percentiles (especially Quantitative Reasoning) can also improve funding odds
Importantly, scholarships are not awarded on score alone. However, percentile strength improves your leverage in competitive applicant pools.
How Schools Interpret Section Strengths vs. Total
The GMAT Focus Edition tests three main areas: Quantitative Reasoning, Verbal Reasoning, and Data Insights. Admissions teams look at your total percentile first. This shows how you performed compared to other test-takers. Your total percentile is the main measure of how competitive you are. Schools also review your section percentiles to understand your strengths.
Your career goals can shape how schools view those strengths. If you plan to go into finance or private equity, a high Quantitative percentile is important because those fields require strong math skills. If you are aiming for consulting, schools like to see a balance between Quantitative and Verbal, since consultants need both analysis and communication skills. For careers in analytics, tech, or product roles, a strong Data Insights score can show that you are comfortable working with data.
Still, your total percentile matters most. Strong section scores can support your story, but they do not make up for a weak overall performance.
How to Use Your Score Chart to Set Prep Targets
When you receive your official score report, you see section percentiles, score ranges, and how you performed relative to other test-takers. Many schools care about percentile positioning because it reflects how competitive you are within the applicant pool.
To set smart test prep goals, compare your current GMAT score percentiles to the average GMAT scores at your target business schools. Focus on the percentile range where admitted students cluster. Your prep targets should close the gap between where you are now and where competitive applicants typically sit.
Reverse-Engineering Your Target Percentile
Start with the end in mind. Instead of asking, “What total score should I get?” ask, “What percentile do successful applicants at my target programs typically reach?” Top business schools often report class medians or averages that align with specific GMAT score percentiles. If a program’s average sits around the 90th percentile, that becomes your benchmark.
Reverse-engineering means working backward from that percentile target. Identify the total score range associated with it, then assess whether your current performance is within reach. If you are already close, your prep plan may focus on refinement. If you are far off, you may need a structured and extended test prep timeline. This approach keeps your effort aligned with real admissions standards, not arbitrary score goals.
Section Prioritization Based on Percentiles
For example, a strong Verbal percentile paired with a weak Quantitative percentile can suppress your total score range. Raising the lowest section often produces the most efficient percentile gains. However, strategy also depends on your goals. Applicants targeting finance-heavy paths may need especially strong Quantitative performance. Those aiming for consulting benefit from balance. Data-focused roles may benefit from higher Data Insights percentiles.
Remember that you should be intentional. Improve what moves the total score meaningfully while reinforcing alignment with your intended career path.
When to Retake (and When Not To)
Consider a retake if your total percentile falls meaningfully below the average GMAT scores at your target business schools. Also consider it if one section percentile is clearly underperforming relative to your ability and you have evidence that targeted test prep can improve it. However, do not retake simply because you want a “perfect” number. If your total score already places you within or above the competitive range for many schools, incremental gains may not materially improve your admissions odds. So, retake only when there is a clear strategic benefit.
Common Misinterpretations & Quick Clarifications
GMAT scores are often misunderstood because applicants focus on isolated numbers instead of context. A raw total score without percentile reference, a school average without distribution data, or a single section score without understanding weighting can lead to flawed decisions.
Let's clear up these common misunderstandings to help you make smarter strategic choices.
“Is X a Good GMAT Score?”
The better question for this is: “Good for which schools?”
There is no universally “good” GMAT score. A total score in the 80th percentile may be competitive at many schools, but it may fall below the average GMAT scores at ultra-selective programs. Likewise, a score at the 90th percentile could be highly competitive at many schools but still slightly below the median at the most selective business schools.
This means that admissions are relative. A score is only “good” if it positions you within or above the competitive percentile range for your target programs.
Percentile Fluctuations & Test Updates
GMAT score percentiles are recalibrated periodically based on recent testing populations. As the pool of test-takers changes, percentile rankings may shift slightly even if the score ranges stay the same. This is normal and does not mean the test became easier or harder overnight. It reflects updated statistical benchmarking. With the transition to the GMAT Focus Edition, concordance tables were released to align legacy scores with the new total score scale. Business schools are aware of these updates and interpret scores accordingly.
Why Average Alone Isn’t Enough
When business schools publish average GMAT scores, that number represents the midpoint of their admitted class. It does not show the full score range. Many schools admit candidates both above and below that average. Being slightly under the average does not automatically disqualify you, just as being slightly above it does not guarantee admission.
What matters more is how your percentile aligns with the school’s broader distribution. A score near the median is typically competitive, but admissions decisions depend on the full application, with academic history, leadership, career progression, and clarity of goals all factors in.
Section Percentiles vs Total Percentile Reality
Admissions committees face one hard truth: your total percentile is what really matters. It is the definitive measure of your academic readiness and the number that ultimately positions you in the competitive pool.
Section percentiles: the Quantitative, Verbal, and Data Insights reveal your area of expertise. They show where you excel, signal your versatility, and help schools interpret your strengths. A high Quantitative percentile can reassure a committee if your background is light on math. A balanced section profile highlights adaptability for roles demanding both analytical and communication skills.
Yet no section score can rescue a total percentile that falls below a program’s competitive threshold. In short, the total percentile dictates your standing while section scores refine the story but never rewrite it.
Ready to Strengthen Your MBA Application?
Understanding your percentile is step one. Deciding whether it meaningfully affects your admissions strategy is step two.
If you’re unsure whether:
- Your total percentile is truly competitive for your target programs
- A retake would materially improve your positioning
- A section imbalance is raising red flags
- Or your score is strong enough to shift focus to the rest of your application
Consulting with an experienced MBA admissions or GMAT advisor can help you assess the strategic ROI of improving your score versus strengthening other components of your candidacy.
Top Coaches
Here are more resources to help you ace your GMAT and navigate the world of business school applications. Check out these articles:
- GMAT Sections Guide: What's Tested and How to Prepare
- How Late Can You Take the GMAT/GRE for MBA Applications?
- The 10 Most Common Mistakes in GMAT Exam Prep and How to Avoid Them
FAQs
How often do GMAT percentiles update?
- GMAT percentiles are updated periodically based on recent test-taker data. They do not change daily but may shift as new performance data is collected over time.
Can GMAT percentiles affect scholarship decisions?
- Yes. Many business schools consider GMAT percentiles when awarding merit-based scholarships, especially when comparing candidates with similar academic profiles.
Can GMAT percentiles shift enough to affect how my score is viewed?
- Slight changes in GMAT percentiles can occur but major shifts are rare. Admissions teams evaluate your score based on the current testing pool at the time of application.
Can a strong GMAT percentile offset a low GPA?
- Yes, to some extent. A high GMAT percentile can demonstrate academic ability and help balance a weaker GPA, but it does not fully replace your academic history.
Should I retake the GMAT if my percentile is below a school’s median?
- Not always. If your GMAT percentile is close to the median and your overall profile is strong, a retake may not significantly improve your chances. Focus on your full application strategy.
What is the most common mistake when reading GMAT percentiles?
- The most common mistake is focusing only on the raw score instead of the GMAT percentile. Percentiles show how you rank compared to other test-takers, which is what admissions teams care about.

Written by Mihir
5.0
(27)
Mihir has helped clients get into organizations like:
Total Quality Logistics
Chicago Booth
The Wharton School (UPenn)
Kellogg School of Management (Northwestern)
Tuck School of Business